If you’ve ever looked at a professional stock chart, it can feel like trying to read a radar screen in a thunderstorm — squiggly lines, overlapping waves, and colorful bars everywhere.
At the center of those charts are stock market indicators. But what actually are they, how do they work, and can they really predict where a stock is heading?
What Is a Stock Market Indicator?
A stock market indicator is simply a mathematical calculation based on historical price, volume, or open interest of a stock or market index.
Instead of looking at earnings reports, management quality, or economic news (which is fundamental analysis), traders use technical indicators to evaluate market sentiment and price behavior (technical analysis).
Think of technical indicators like a dashboard in a car:
- The Speedometer tells you how fast price is moving right now (momentum).
- The Fuel Gauge tells you how much energy is left in the drive (volume).
- The GPS maps out where the road has traditionally bent or turned (support and resistance).
How Do Indicators Actually Work?
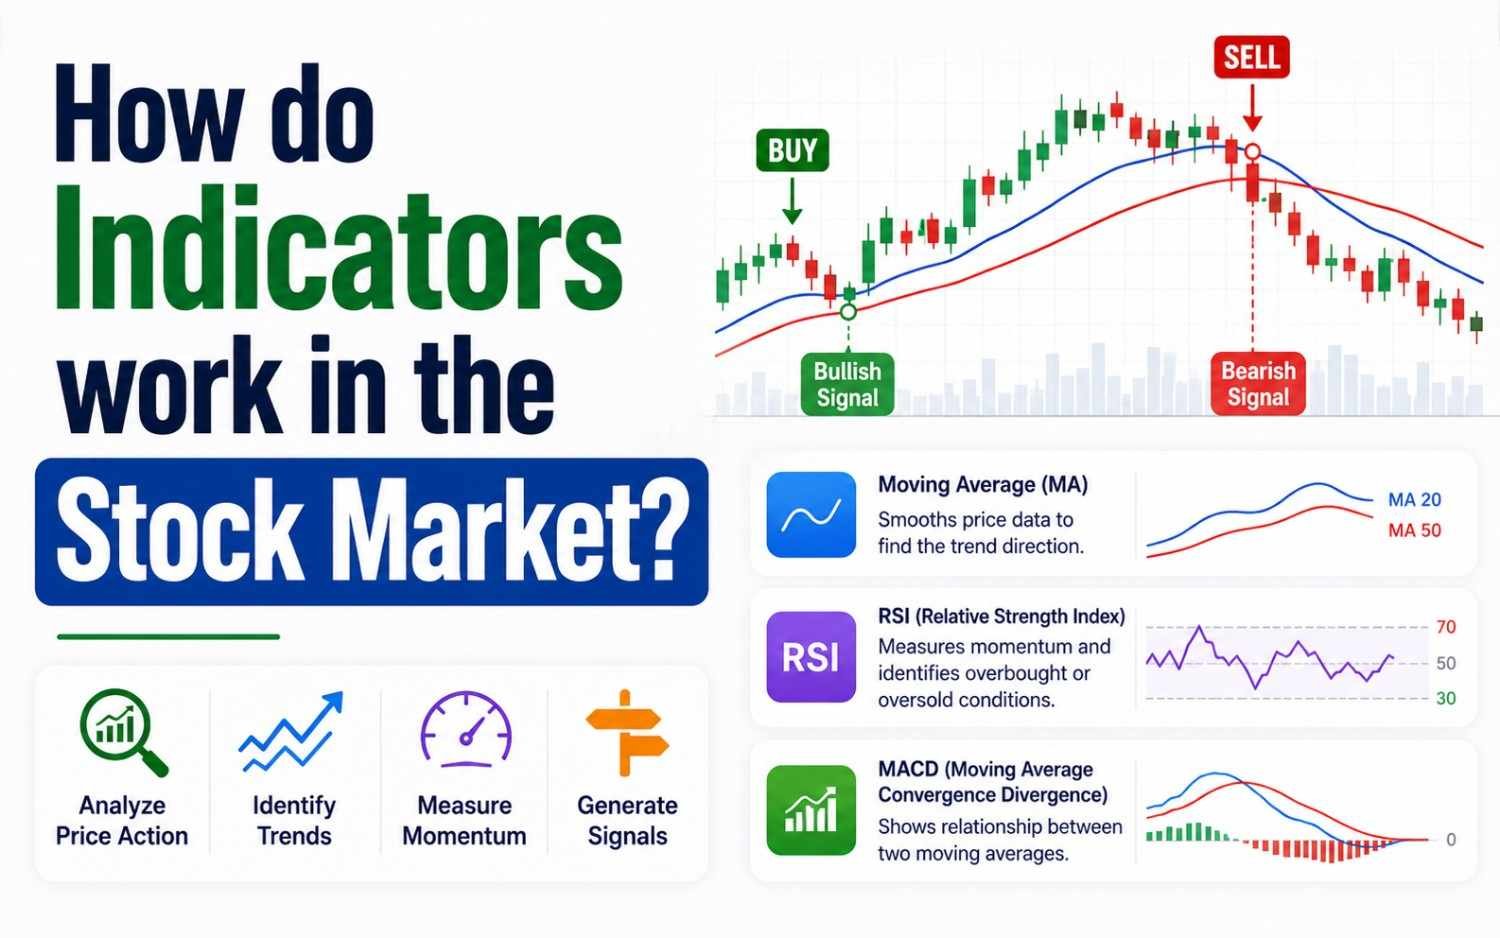
Indicators do not have a crystal ball. They take raw trade data — usually the opening, high, low, and closing prices (OHLC) over a set timeframe — and run it through a specific formula.
The output is plotted visually on or underneath the price chart, making complex trading data easy to digest at a glance.
[Raw Price & Volume Data] ➔ [Mathematical Formula] ➔ [Visual Line/Histogram on Chart]
The Two Major Operating Styles
Most indicators fall into one of two behavior patterns:
| Indicator Type | How It Behaves | Primary Goal | Example |
| Overlay Indicators | Plotted directly on top of the price chart | Identifies current trends and price zones | Moving Averages, Bollinger Bands |
| Oscillators | Plotted in a separate box above or below the price chart | Measures momentum and extreme boundaries (overbought/oversold) | Relative Strength Index (RSI), MACD |
The 4 Core Categories of Indicators
To build a balanced strategy, traders generally rely on four distinct categories of technical indicators:
1. Trend Indicators (Direction)
Trend indicators filter out market “noise” to tell you which way the dominant current is flowing.
- Moving Averages (SMA / EMA): Smooths out price action by calculating average prices over a set period (e.g., 50-day or 200-day). When price stays above the average line, the trend is considered bullish (upward).
2. Momentum Indicators (Speed & Strength)
Momentum tools measure how aggressively price is moving in a given direction.
- Relative Strength Index (RSI): Measures the speed of recent price changes on a scale from 0 to 100.
- An RSI above 70 suggests a stock may be overbought (due for a cooling-off period).
- An RSI below 30 suggests a stock may be oversold (potentially primed for a bounce).
3. Volatility Indicators (Price Range)
Volatility measures how violently a stock’s price is fluctuating around its average.
- Bollinger Bands: Consists of a center moving average with two outer bands that expand when volatility spikes and contract when the market cools down. Price touching the outer bands often signals high statistical deviation.
4. Volume Indicators (Market Conviction)
Volume measures how many shares are actively changing hands.
- On-Balance Volume (OBV): Combines volume and price movement to reveal whether institutional investors are quietly accumulating (buying) or distributing (selling) shares before major price breakouts occur.
Leading vs. Lagging Indicators: A Crucial Distinction
Understanding the difference between leading and lagging signals trips up almost every beginner:
Lagging Indicators: Confirm trends after they have already begun. They are slower to signal, but they offer far higher reliability and fewer false alarms (e.g., Moving Averages).
Leading Indicators: Attempt to predict price turns before they happen. They give early signals, but they carry a much higher rate of “false positives” (e.g., RSI, Stochastic Oscillators).
The Golden Rule: Avoid “Indicator Overload”
A common mistake made by new traders is cluttering a chart with five or six different indicators. When every line points in a different direction, you end up with analysis paralysis.
A Simple, Effective Setup
Instead of stacking similar tools, pick one indicator per category:
- Trend: 50-day Exponential Moving Average (EMA)
- Momentum: Relative Strength Index (RSI)
- Volume: Daily Volume Bars
No indicator works 100% of the time. Successful traders view indicators as supporting clues in a larger story — pairing them with price patterns, market context, and strong risk management.