Imagine driving a car down a foggy mountain road. You rely on your speedometer to check your pace, your GPS to anticipate sharp turns, and fuel gauges to ensure you don’t run out of gas.
In the stock market, technical indicators serve as the dashboard for investors and traders. They turn complex raw price and volume data into visual signals, helping market participants navigate market trends, gauge sentiment, and make informed buying or selling decisions.
What is a Stock Market Indicator?
A stock market indicator is a mathematical calculation based on historical price, volume, or open interest of a stock or market index.
Instead of relying on gut feeling or raw chart price action alone, traders overlay these statistical calculations onto price charts. These tools help identify where price momentum is heading, whether a stock is overvalued or undervalued, and when a trend might reverse.
Two Primary Categories: Leading vs. Lagging
To build a balanced strategy, traders generally divide indicators into two main types based on how they process data:
- Leading Indicators: These attempt to predict future price movements before they happen. They are best for identifying potential reversals early, though they can sometimes generate false signals during strong trends. (Example: Relative Strength Index)
- Lagging Indicators: These follow price movements and confirm trends that are already underway. They offer higher accuracy but signal trades slightly later. (Example: Moving Averages)
The 4 Core Types of Technical Indicators
Traders group indicators based on the specific market behavior they measure:
| Indicator Category | Purpose | Common Examples | How Traders Use Them |
| Trend | Identifies the direction and strength of market movement. | Moving Averages (SMA/EMA), MACD | Signals whether to buy in an uptrend or sell in a downtrend. |
| Momentum (Oscillators) | Measures the speed of price changes to spot overbought or oversold conditions. | Relative Strength Index (RSI), Stochastic | Signals potential price pullbacks or momentum shifts. |
| Volatility | Tracks the range and intensity of price fluctuations. | Bollinger Bands, Average True Range (ATR) | Measures market risk and potential breakout zones. |
| Volume | Evaluates trading activity and institutional interest. | On-Balance Volume (OBV), Volume Weighted Average Price (VWAP) | Confirms whether price movements have strong market backing. |
3 Essential Indicators Every Beginner Should Know
1. Moving Averages (MA)
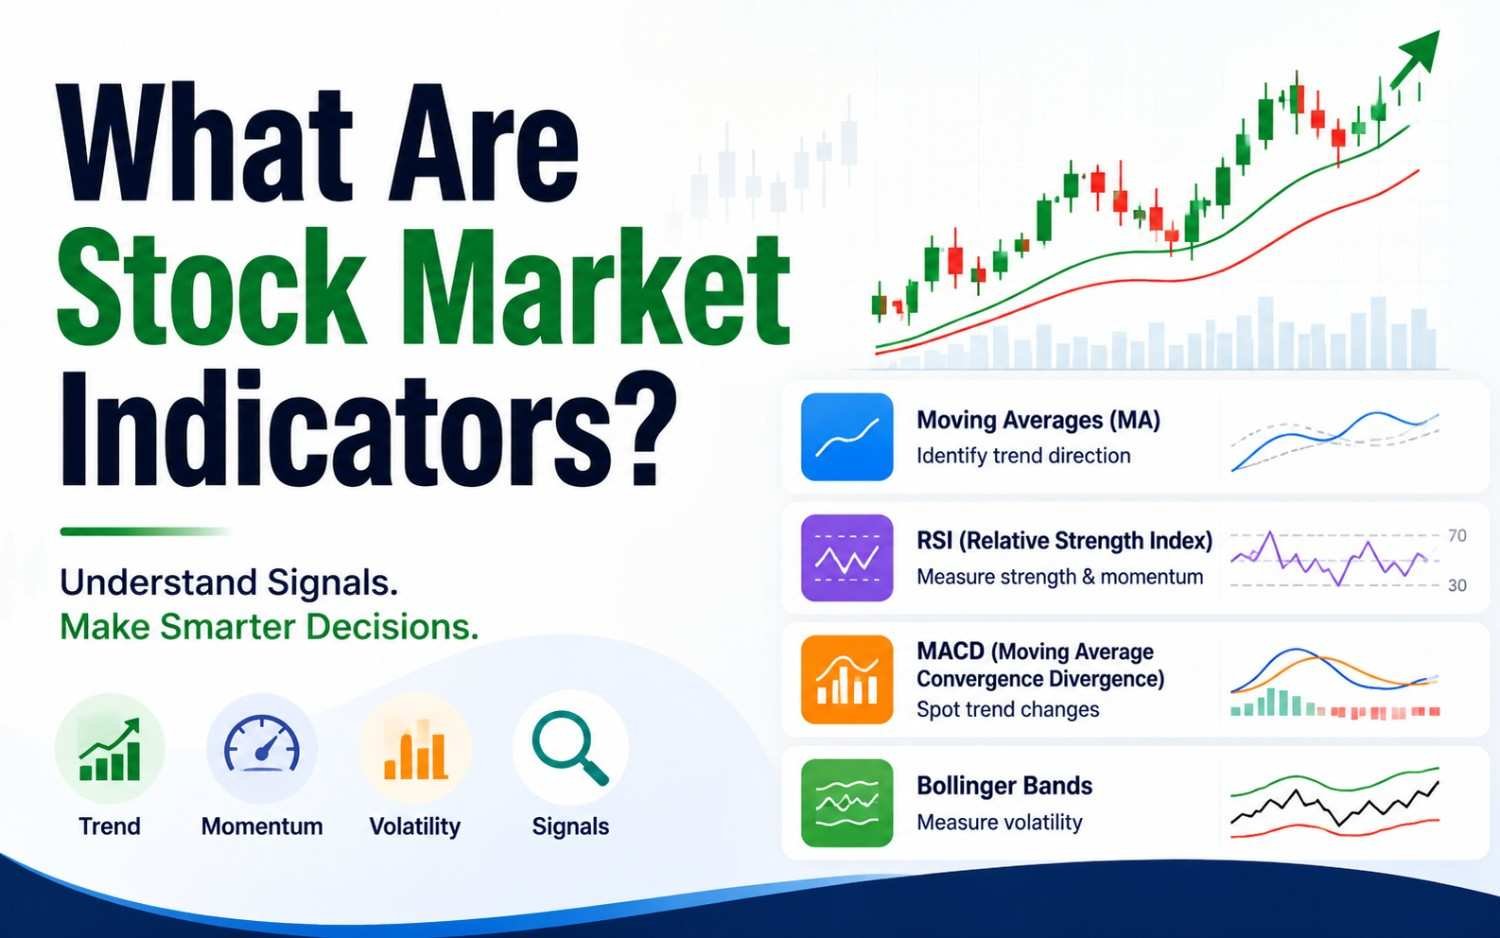
A Moving Average smooths out short-term price noise by calculating an average price over a set period (like 50 or 200 days). When a short-term average crosses above a long-term average (known as a “Golden Cross”), it typically signals a strong bullish trend.
2. Relative Strength Index (RSI)
RSI measures price momentum on a scale from 0 to 100:
- Above 70: Indicates a stock may be overbought (priced too high, due for a dip).
- Below 30: Indicates a stock may be oversold (priced low, due for a rebound).
3. Moving Average Convergence Divergence (MACD)
MACD shows the relationship between two moving averages of a stock’s price. When the MACD line crosses above the signal line, it suggests buying momentum is accelerating.
Pro Tip for Traders: No single indicator is 100% accurate. Professional traders combine two or three complementary indicators—such as a trend indicator paired with a volume indicator—to confirm signals before entering a trade.